Designing Financial Dashboards: Visualizing Financial Analytics
What Is a Financial Dashboard?
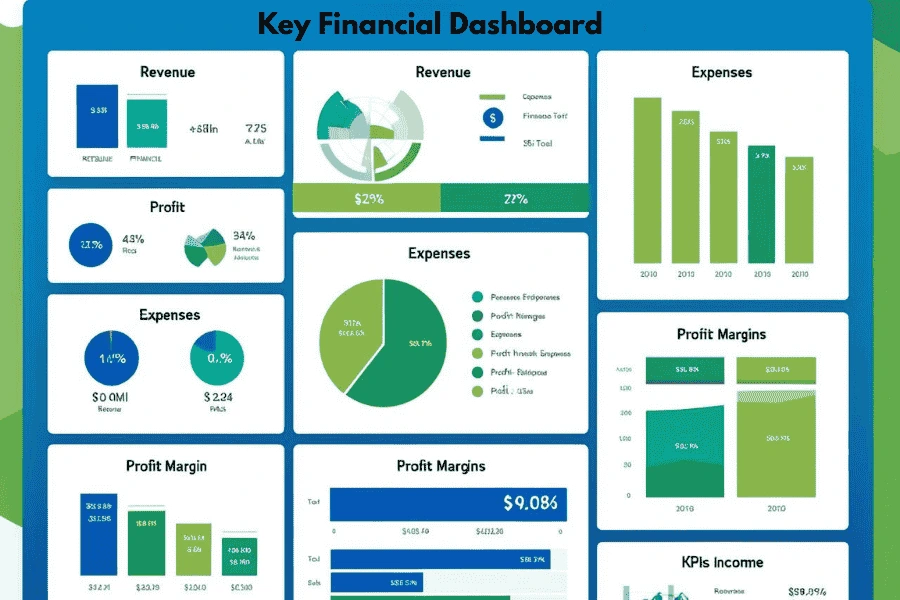
A financial dashboard is a visual tool that consolidates important financial metrics and KPIs into an intuitive interface. By gathering data from multiple sources such as accounting software, ERP systems, and bank records, these dashboards display the information via charts, graphs, and tables. This makes it easier for users to quickly assess financial health and trends without sifting through complex reports.
Key Components of Effective Financial Dashboards
Successful financial dashboards share several key features: Clear and relevant KPIs like revenue, expenses, cash flow, and profit margins. Logical layout that groups related data and ensures easy navigation. A variety of visual elements such as line charts, bar graphs, pie charts, and gauges tailored to the data. Interactive elements that enable users to filter and drill down into detailed data. Real-time data integration for up-to-date financial insights.
Benefits of Financial Dashboards
Financial dashboards streamline decision-making by providing instant access to critical metrics, reducing errors through automation, and helping users spot trends early. They support goal tracking and enhance communication across teams by offering a shared, transparent view of financial performance.
Best Practices in Designing Financial Dashboards
To design dashboards that truly serve their users, focus on simplicity and clarity. Use consistent color schemes to convey meaning and tailor the content to the audience’s needs. Make sure dashboards are mobile-friendly and regularly updated to reflect the latest data.
Tools and Technologies for Financial Dashboard Creation
Popular tools for building financial dashboards include Microsoft Power BI, Tableau, Google Data Studio, Excel, and enterprise solutions like Looker and Qlik. Each offers unique strengths in terms of ease of use, data integration, and visualization capabilities.
Use Cases: How Financial Dashboards Drive Results
Financial dashboards are invaluable for small business owners tracking cash flow, financial analysts monitoring KPIs, executives overseeing company health, and individuals managing personal finances. They provide clear, actionable insights that support smarter financial decisions.
Conclusion
Designing financial dashboards is essential to turning complex financial data into actionable insights. With the right design principles and tools, dashboards enable faster, more accurate decision-making in both personal and professional finance contexts. Embracing dashboards is key to succeeding in today’s data-driven financial landscape.
Active Events
3 Must Have Projects On your CV to Get into Data Analysis
Date: Aug 05, 2025 | 7:00 PM(IST)
7:00 PM(IST) - 8:10 PM(IST)
2753 people have registered
From Zero to Hero: The Untold Secrets of Becoming a Full Stack Developer
Date: Aug 06, 2025 | 7:00 PM(IST)
7:00 PM(IST) - 8:10 PM(IST)
2749 people have registered
Bootcamps
Data Science Bootcamp
- Duration:4 Months
- Start Date:Aug 09, 2025
Data Analyst Bootcamp
- Duration:4 Months
- Start Date:Aug 09, 2025